PINACLE Dashboard Futurization
Creating a new task-based, user-centric homepage for PNC's flagship corporate banking platform.
At a Glance
- Replaced a decade-old static homepage with a customizable, widget-based dashboard.
- Defined a scalable widget framework used by 20+ PINACLE product teams.
- Validated layouts and interactions through multiple client sessions and PINACLE User Group testing.
Overview
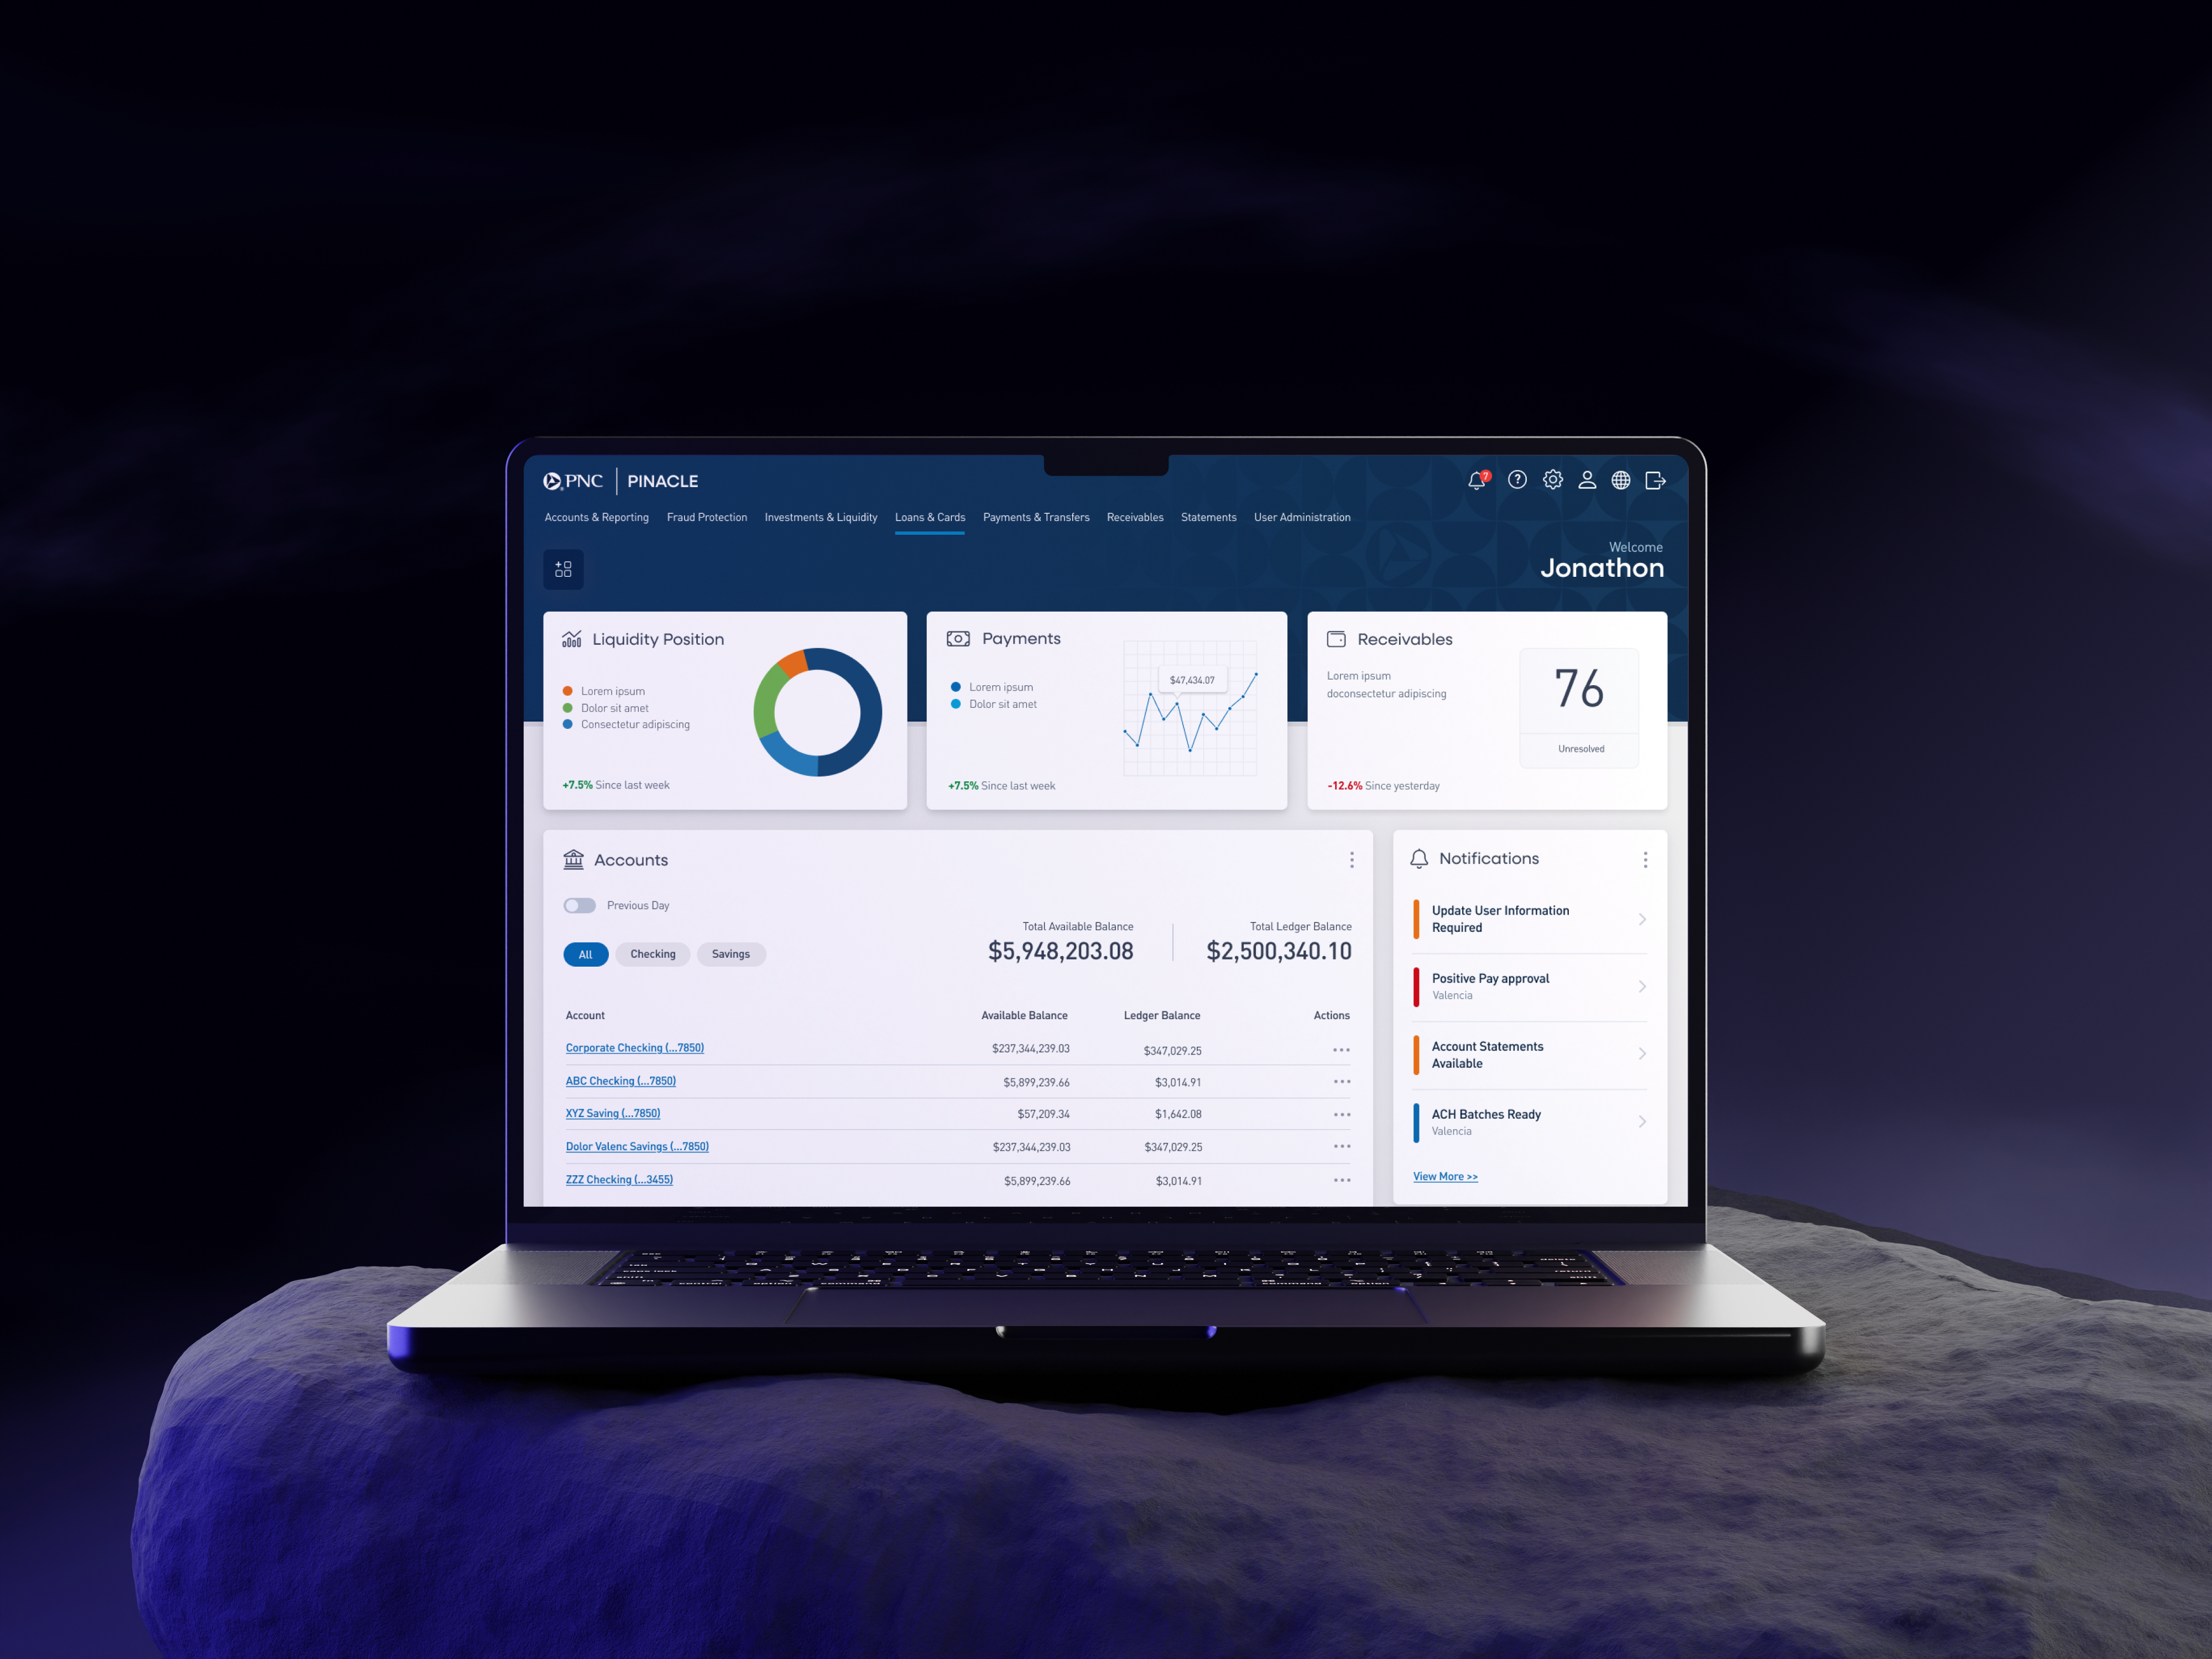
The PINACLE corporate banking dashboard had not been modernized in over a decade, leaving clients with a dated, static, and inefficient homepage experience. Over the past two years, I led the effort to reimagine this entry point into the platform.
Working with clients, product partners, and engineering, we created a modern, task-based dashboard designed for customization, efficiency, and long-term scalability. The new experience introduces a widget-based system that lets clients configure their workspace around the tasks and insights most critical to them.
My Role & Team
As UX Manager for the PINACLE platform, I:
- Led research and client validation at scale, including multiple rounds of client interviews and live testing sessions at the PINACLE User Group conference.
- Directed and collaborated with two lead designers, who partnered with dozens of service teams to design widgets tied to their respective products.
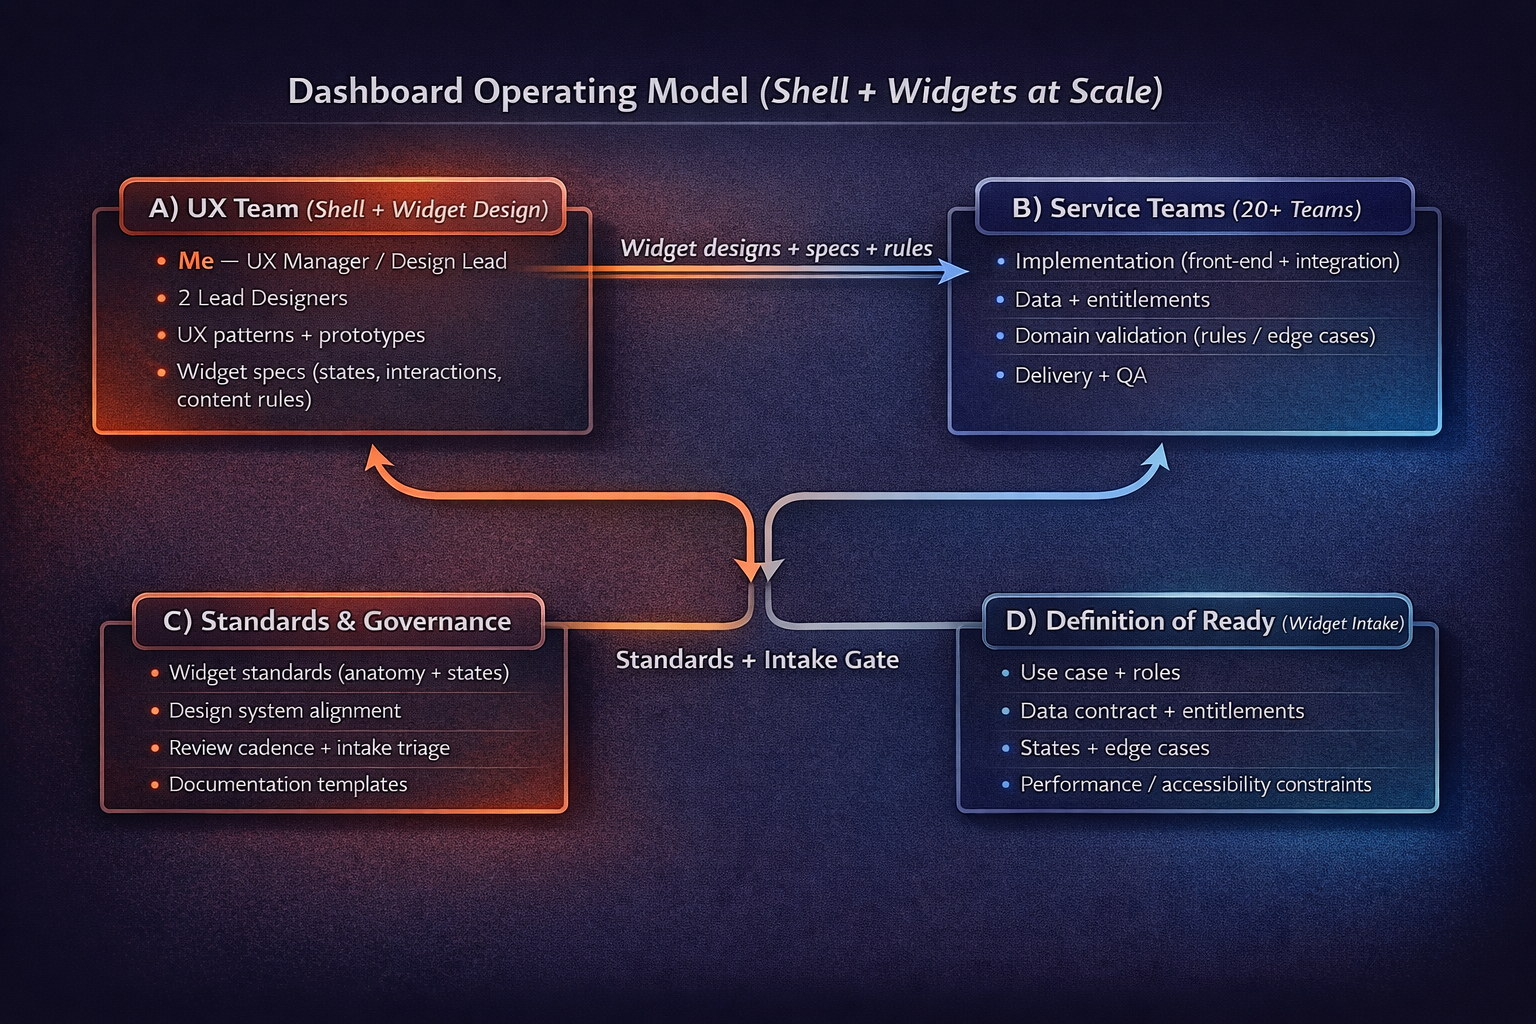
- Defined the widget governance model so 20+ product teams could design dashboard widgets consistently across PINACLE.
- Established a repeatable “definition of ready” for dashboard widgets, including UX flows, states, and data requirements prior to development.
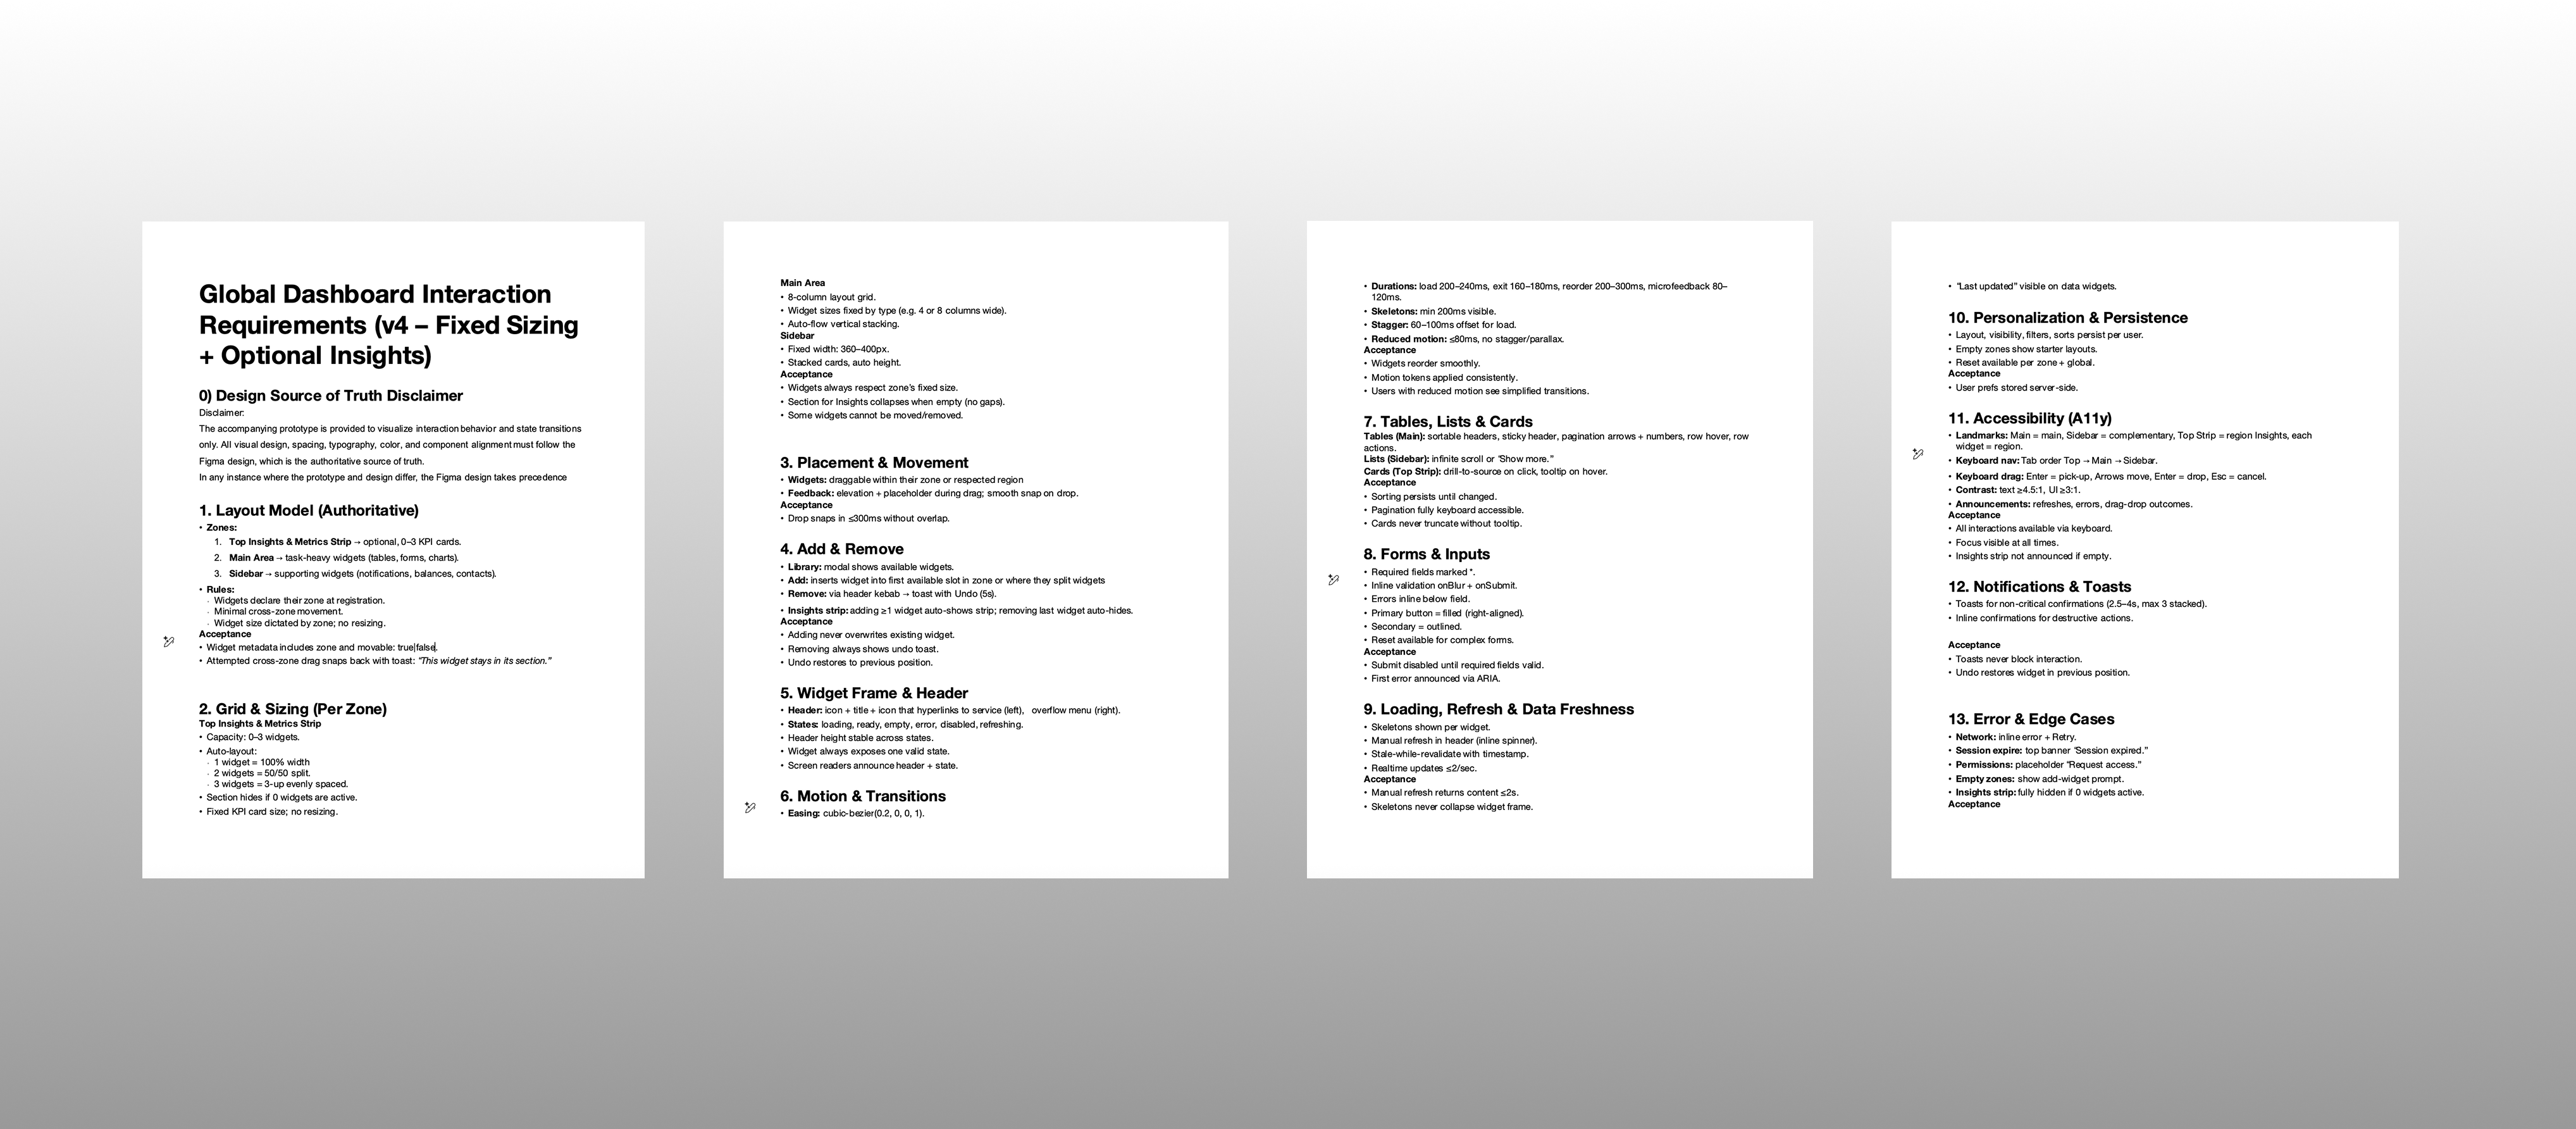
- Contributed directly to design work by producing mockups, interactive prototypes, and detailed interaction requirement documents to support engineering.
Context & Challenge
The legacy dashboard was antiquated, rigid, and cluttered:
- Limited customization options for users with very different job roles.
- Outdated visual design that did not reflect PINACLE’s modern capabilities.
- Limited visibility into high-value tasks (approvals, exceptions, alerts).
- No consistent way to surface insights across dozens of services.
The challenge was to design a flexible, modern dashboard that:
- Scales across dozens of PINACLE services and use cases.
- Balances insightful data visualization with clearly actionable tasks.
- Supports customization without overwhelming clients with complexity.
- Can be maintained and evolved by multiple product teams over time.
Research & Discovery
We conducted client interviews, workflow reviews, and prototype testing to understand what users value in a dashboard experience:
- Quick access to pending tasks and approvals.
- Visibility into balances and key indicators without digging into reports.
- Flexibility to arrange the dashboard based on role and daily workflow.
- Confidence that what they see is current and trustworthy.
At our annual PINACLE User Group conference, we tested multiple dashboard prototypes with clients, validating widget concepts, layouts, and customization patterns.
Design & Solution
To balance insight and action, we structured the dashboard into three primary zones:
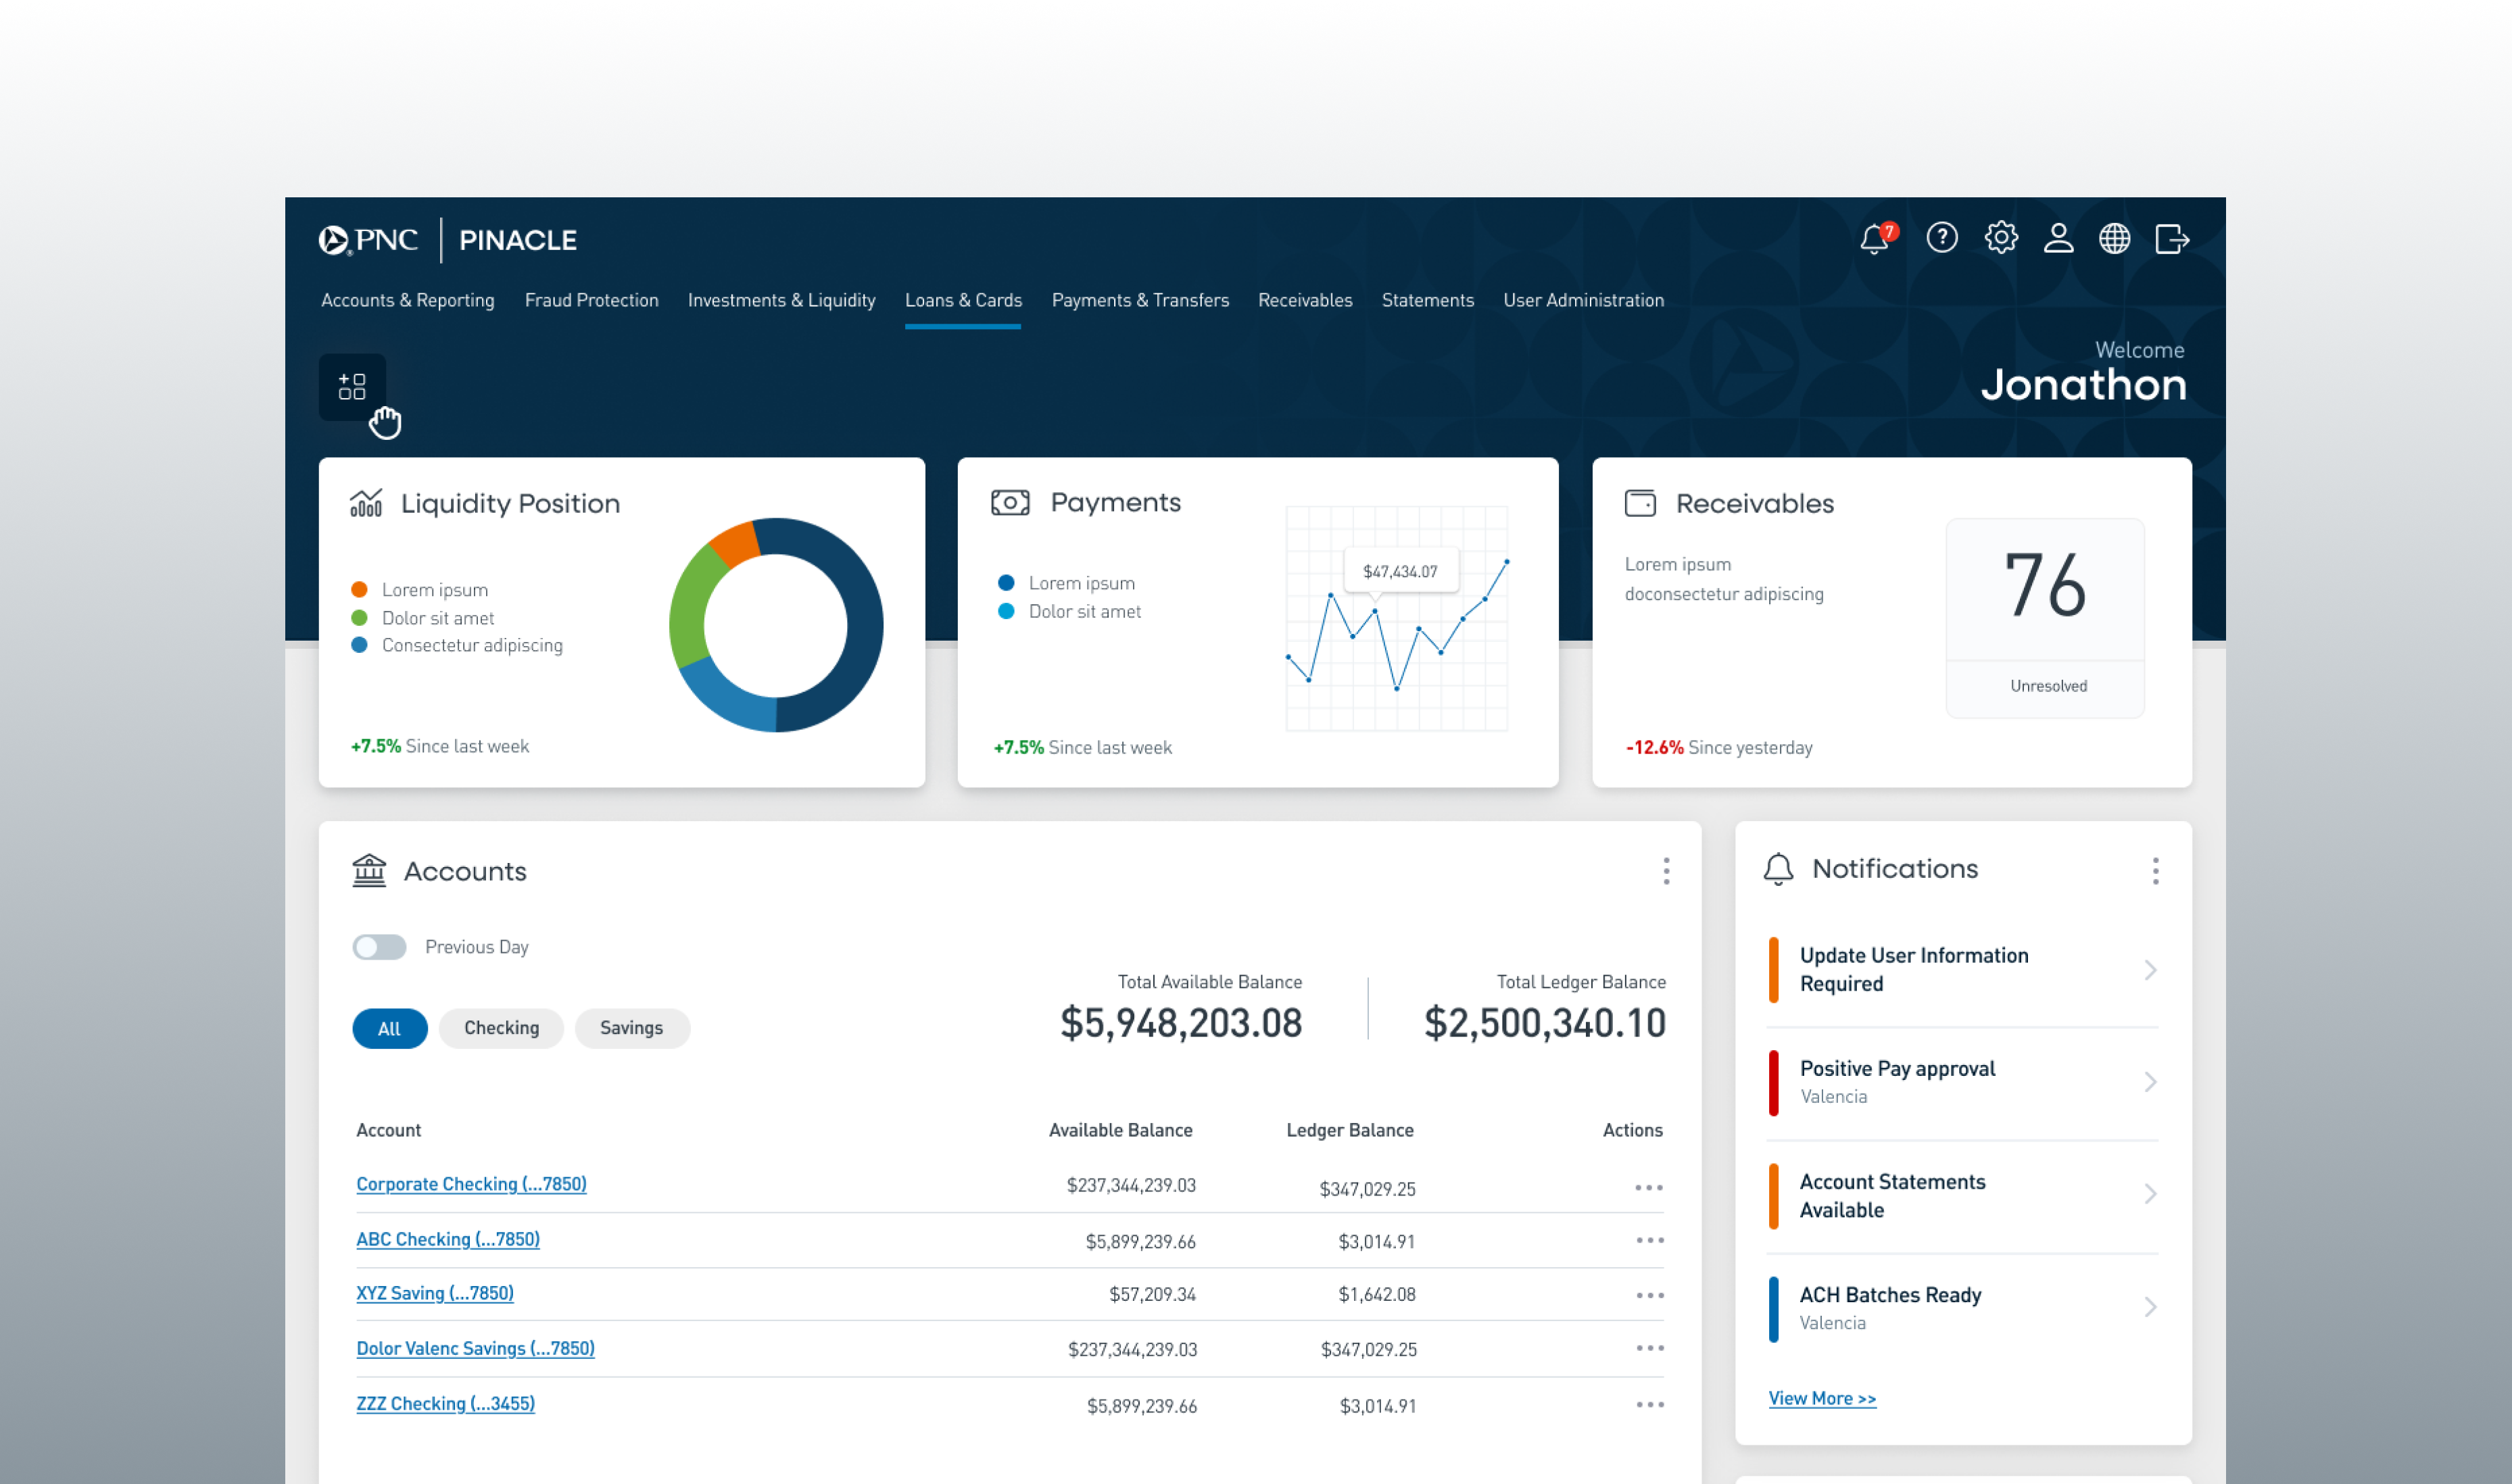
1. Insights & Metrics Strip (Top)
- Lightweight data visualizations such as cash insights and key real-time metrics.
- Always visible to provide a quick health check across accounts and services.
2. Main Area (3/4 Page)
- Dedicated to larger, more complex widgets (e.g., balances, funds transfers, receivables).
- Designed for analysis-heavy tasks that need more space and richer visualization.
3. Sidebar (1/4 Page)
- Reserved for smaller, actionable widgets like tasks, approvals, favorite reports, and contacts.
- Keeps daily workflow items close at hand without crowding the main area.
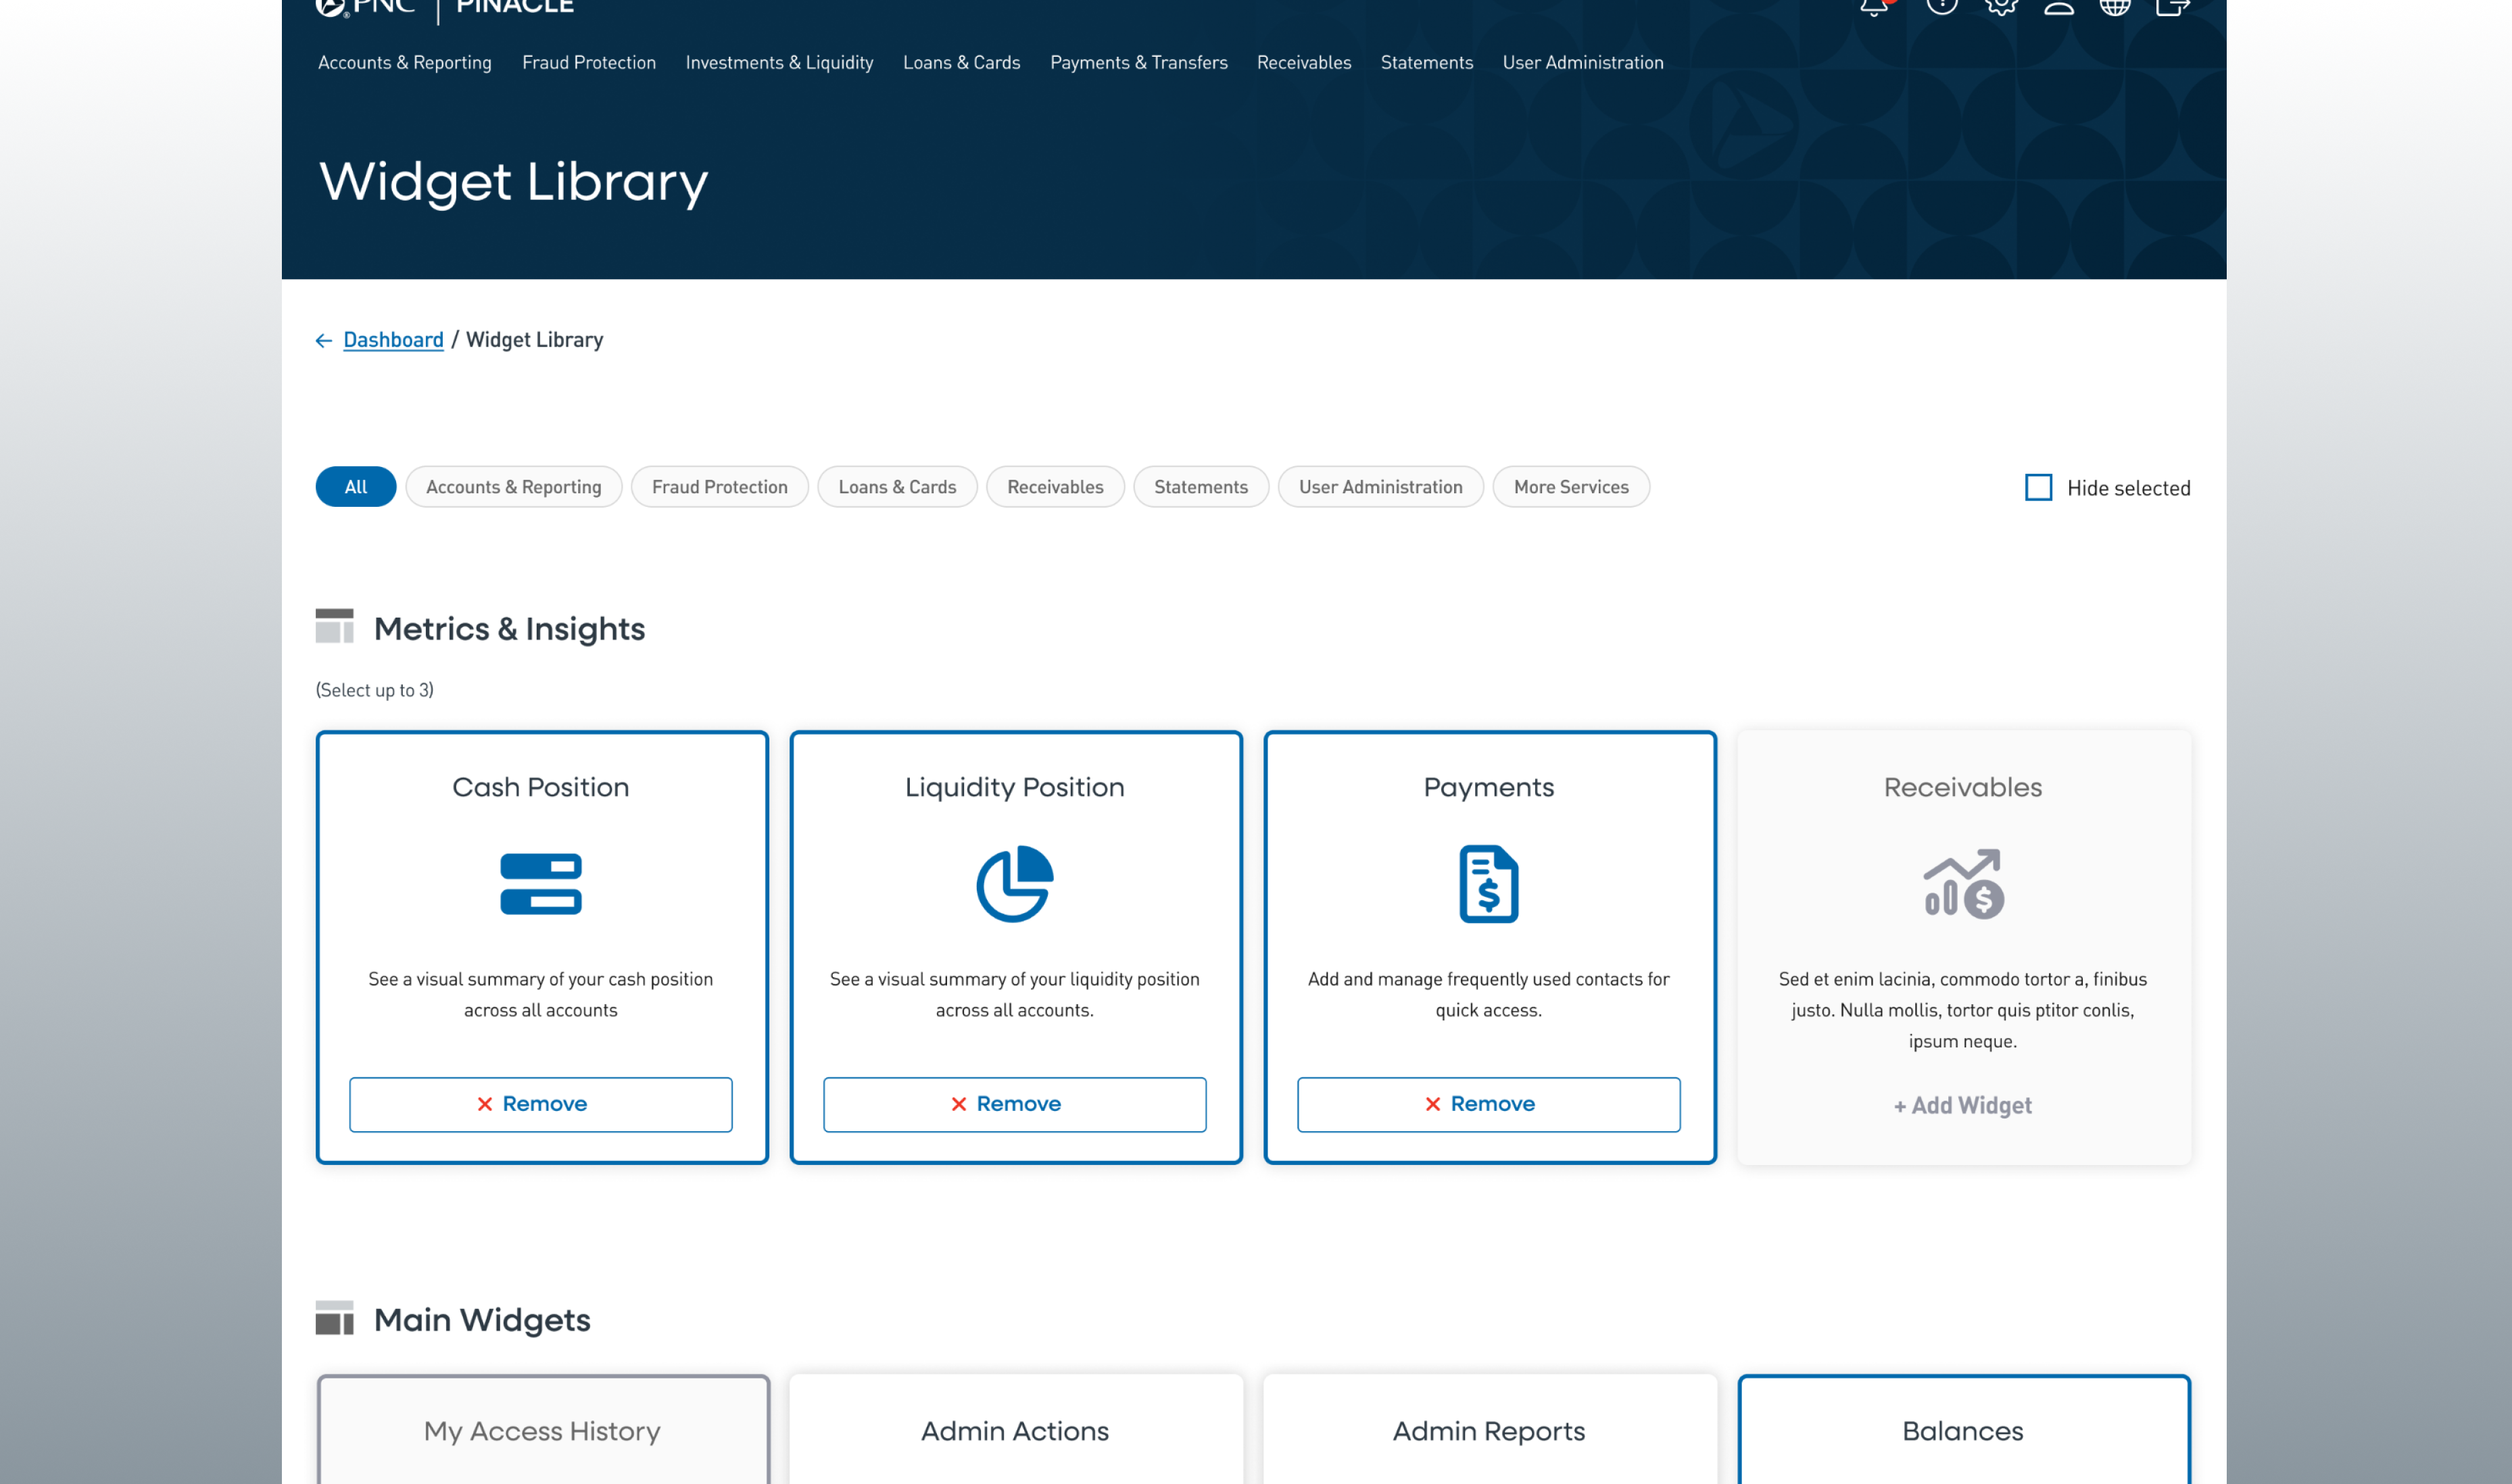
Widget Library
Clients can open the widget library to turn widgets on or off. Each widget corresponds to a PINACLE service, ensuring discoverability while keeping the dashboard streamlined.
Drag-and-Drop Grid Layout
Widgets can be moved between zones using a drag-and-drop interaction, allowing clients to tailor their dashboard without overwhelming them with too much flexibility.
Testing & Validation
- Internal validation with design and product teams to refine workflows, edge cases, and states for each widget.
- Client validation at PINACLE User Group conference sessions, where we observed how clients interacted with high-fidelity prototypes.
- Iterative testing to ensure the dashboard struck the right balance between customization, simplicity, and performance.

Implementation & Scalability
The dashboard was built in Angular with a drag-and-drop grid system, supported by:
Widget workflow documentation: Detailed flows for each widget, ensuring consistent design and development across teams.
Interaction requirement documents: Authored by me to guide developers on states, error handling, and component behaviors.
Reusable components: Designed for long-term scalability across PINACLE services, aligned with our design system.
The MVP release is scheduled for Q1 2026, with a roadmap for additional widgets and enhancements based on client adoption and feedback.
Impact & Expected Outcomes
- Personalized dashboards tailored to each client’s workflow, improving relevance of information on first load.
- Faster access to tasks and approvals, reducing time spent navigating deep menus and multiple pages.
- A scalable widget framework that allows PNC to add new functionality without redesigning the dashboard shell.
- Improved client perception of PINACLE’s modernization and responsiveness to user feedback.
Leadership Reflection
This project required not just design innovation, but orchestration across dozens of teams and stakeholders. My role was to keep the vision unified, ensure client voices were consistently represented, and give developers clear requirements for complex workflows.
Leading this effort reinforced the importance of balancing strategic direction, hands-on design work, and cross-functional facilitation in large-scale enterprise design programs.